The following options appear on the four k-Nearest Neighbors Regression dialog tabs.
K-Nearest Neighbors Regression dialog, Data tab
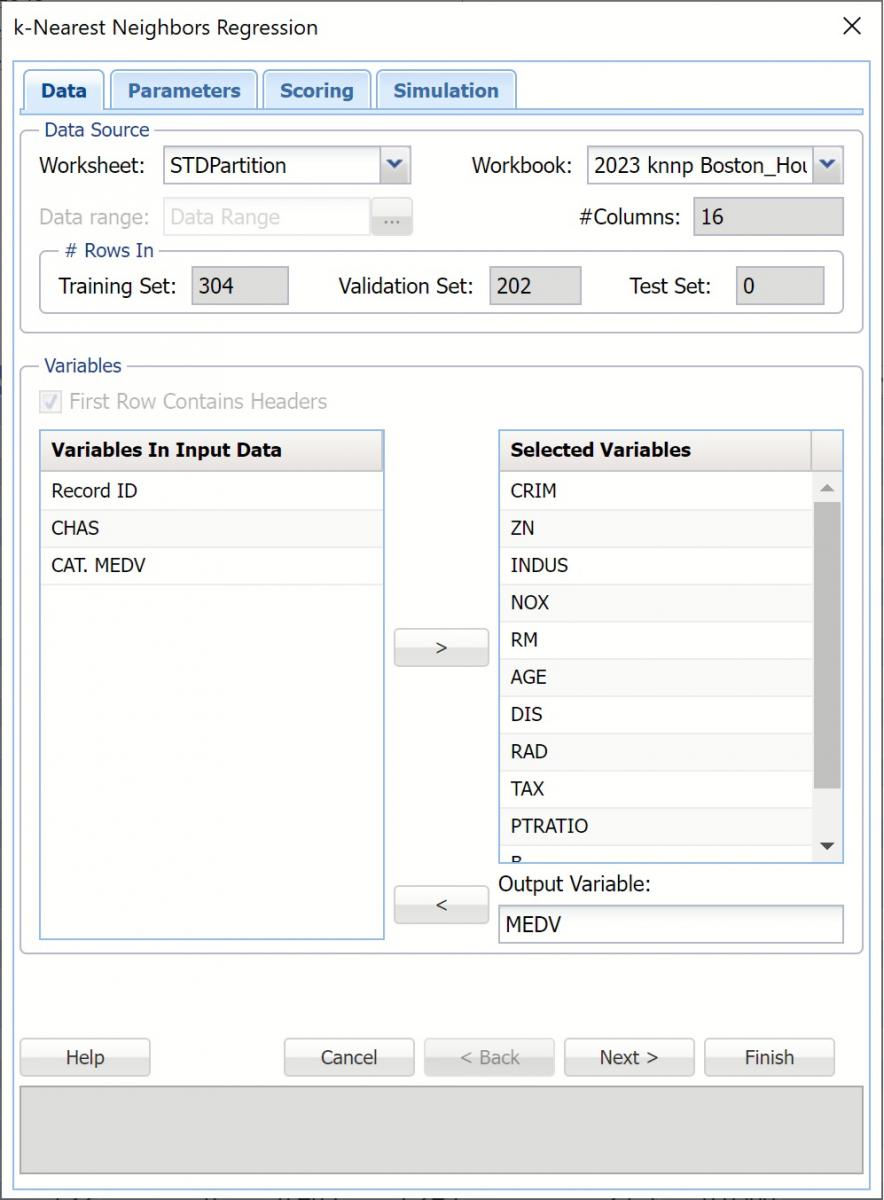 Variables In Input Data
All variables in the data set are listed here.
Selected Variables
Variables listed here will be utilized in the Analytic Solver Data Science output.
Output Variable
Select the variable whose outcome is to be predicted here.
K-Nearest Neighbors Regression dialog, Parameters tab
Following are descriptions of the options available on the k-Nearest Neighbors Regression Parameters dialog tab.
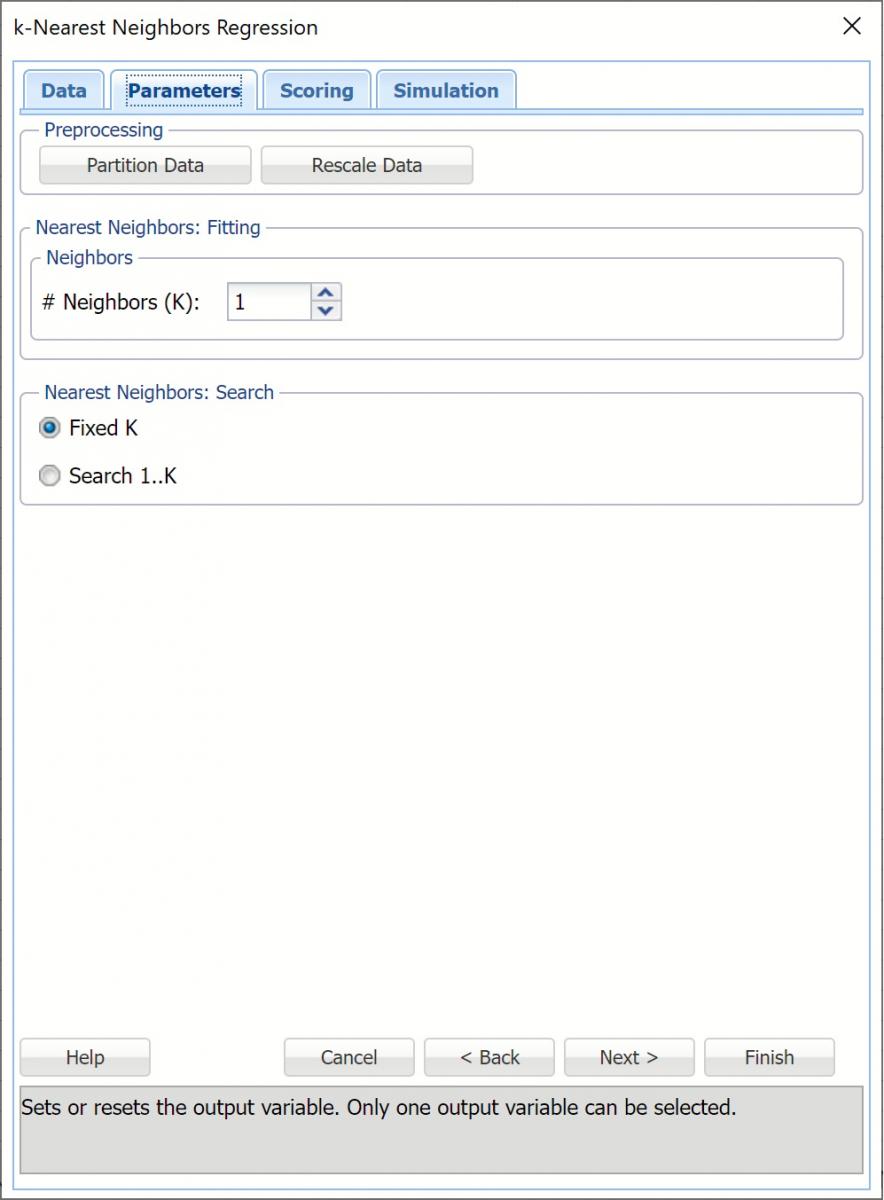 Partition Data
Analytic Solver Data Science includes the ability to partition a dataset from within a classification or regression (prediction) method by selecting Partition Options on the Parameters tab. If this option is selected, Analytic Solver Data Science will partition your dataset (according to the partition options you set) immediately before running the prediction method. If partitioning has already occurred on the dataset, this option will be disabled. For more information on partitioning, please see the Data Science Partitioning chapter.
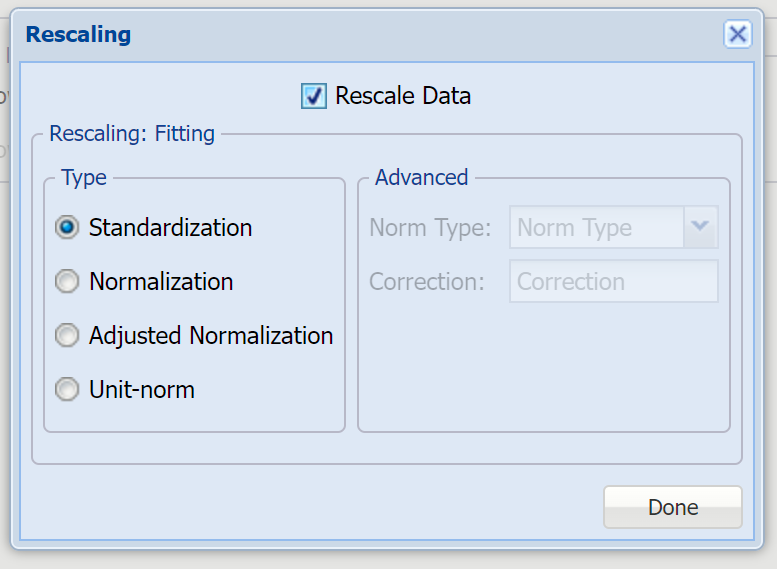
Rescale Data
Click Rescale Data to open the Rescaling dialog.
Use Rescaling to normalize one or more features in your data during the data preprocessing stage. Analytic Solver Data Science provides the following methods for feature scaling: Standardization, Normalization, Adjusted Normalization and Unit Norm. For more information on this new feature, see Rescale Continuous Data.
# Neighbors (k)
This is the parameter k in the k-nearest neighbor algorithm. If the number of observations (rows) is less than 50 then the value of k should be between 1 and the total number of observations (rows). If the number of rows is greater than 50, then the value of k should be between 1 and 50. The default value is 1.
Nearest Neighbors Search
If Search 1..K is selected, Analytic Solver Data Science will display the output for the best k between 1 and the value entered for # Neighbors (k).
If Fixed K selected, the output will be displayed for the specified value of k. This is the default setting.
K-Nearest Neighbors Regression dialog, Scoring tab
The following options appear on the k-Nearest Neighbors Regression dialog on the Scoring tab.
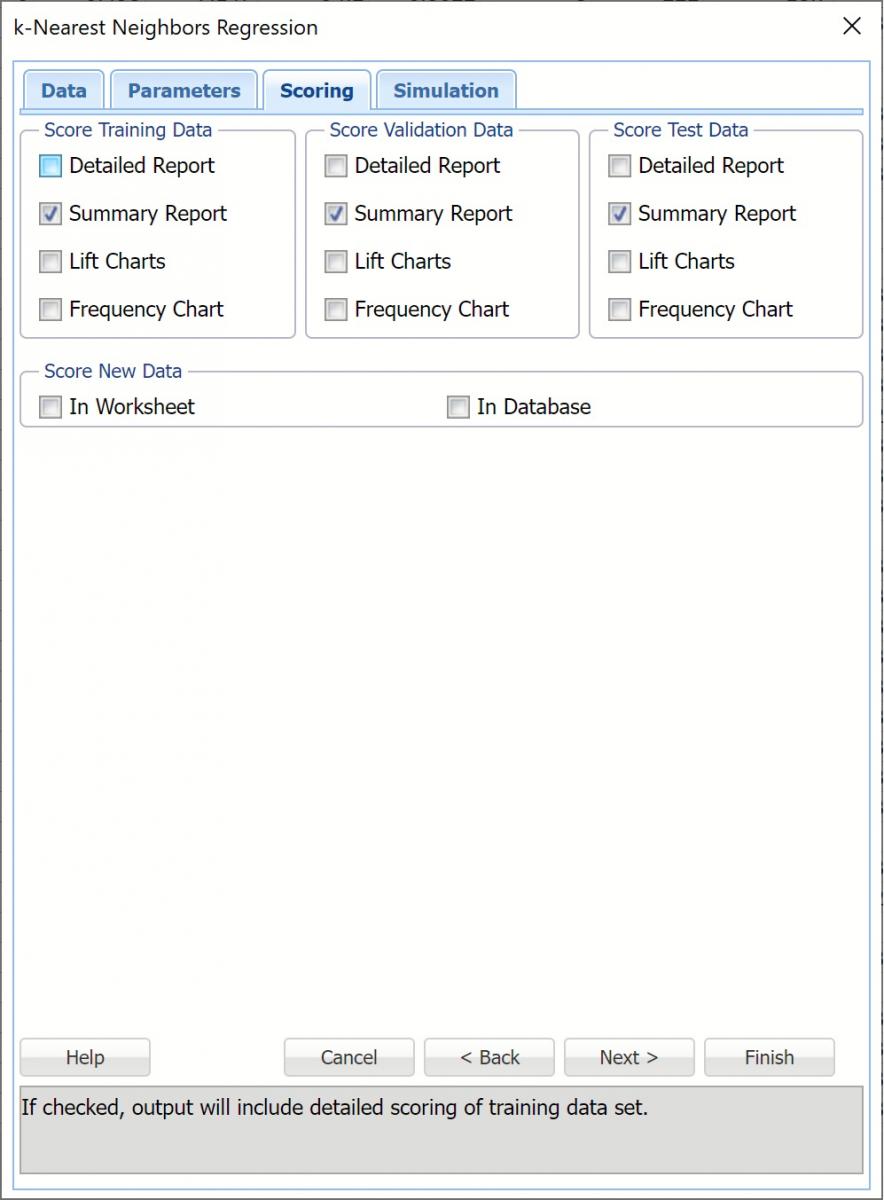 Score Training Data
Select these options to show an assessment of the performance of the k-Nearest Neighbors Regression algorithm in predicting the value of the output variable in the training data. The report is displayed according to your specifications - Detailed, Summary, and Lift charts.
New in V2023: When Frequency Chart is selected, a frequency chart will be displayed when the KNNP_TrainingScore worksheet is selected. This chart will display an interactive application similar to the Analyze Data feature. This chart will include frequency distributions of the actual and predicted responses individually, or side-by-side, depending on the user's preference, as well as basic and advanced statistics for variables, percentiles, six sigma indices.
Score Validation Data
These options are enabled when a validation data set is present. Select these options to show an assessment of the performance of the k-Nearest Neighbors Regression algorithm in predicting the value of the output variable in the validation data. The report is displayed according to your specifications - Detailed, Summary, and Lift charts. When Frequency Chart is selected, a frequency chart (described above) will be displayed when the KNNP_ValidationScore worksheet is selected.
Score Test Data
These options are enabled when a test set is present. Select these options to show an assessment of the performance of the k-Nearest Neighbors Regression algorithm in predicting the value of the output variable in the test data. The report is displayed according to your specifications - Detailed, Summary, and Lift charts. When Frequency Chart is selected, a frequency chart (described above) will be displayed when the KNNP_TestScore worksheet is selected.
Score New Data
See Applying Your Model for more information on the options located in the Score New Data groups.
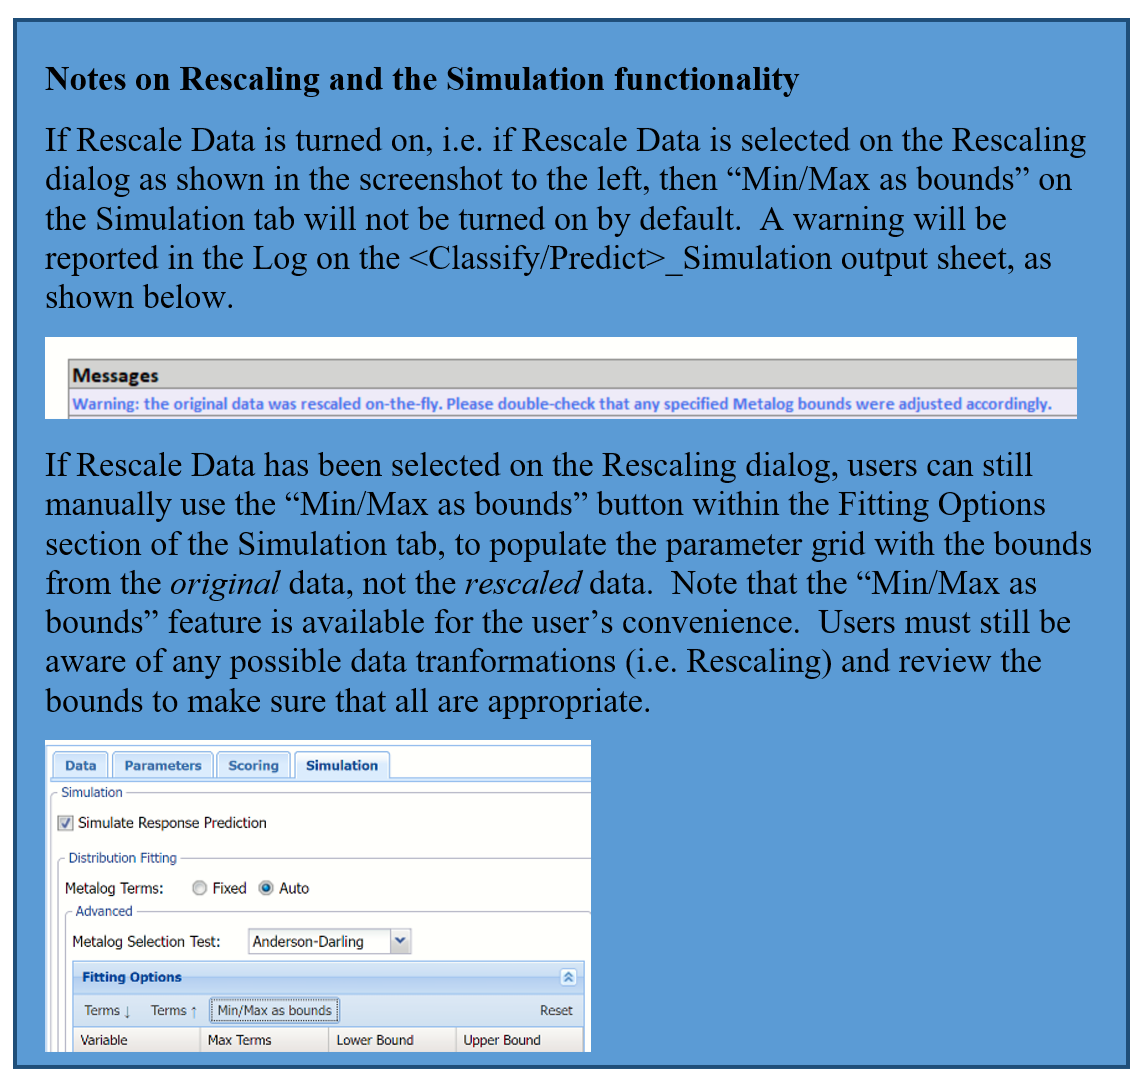
K-Nearest Neighbors Regression dialog, Simulation tab
The following options appear on the k-Nearest Neighbors Regression dialog on the Simulation tab.
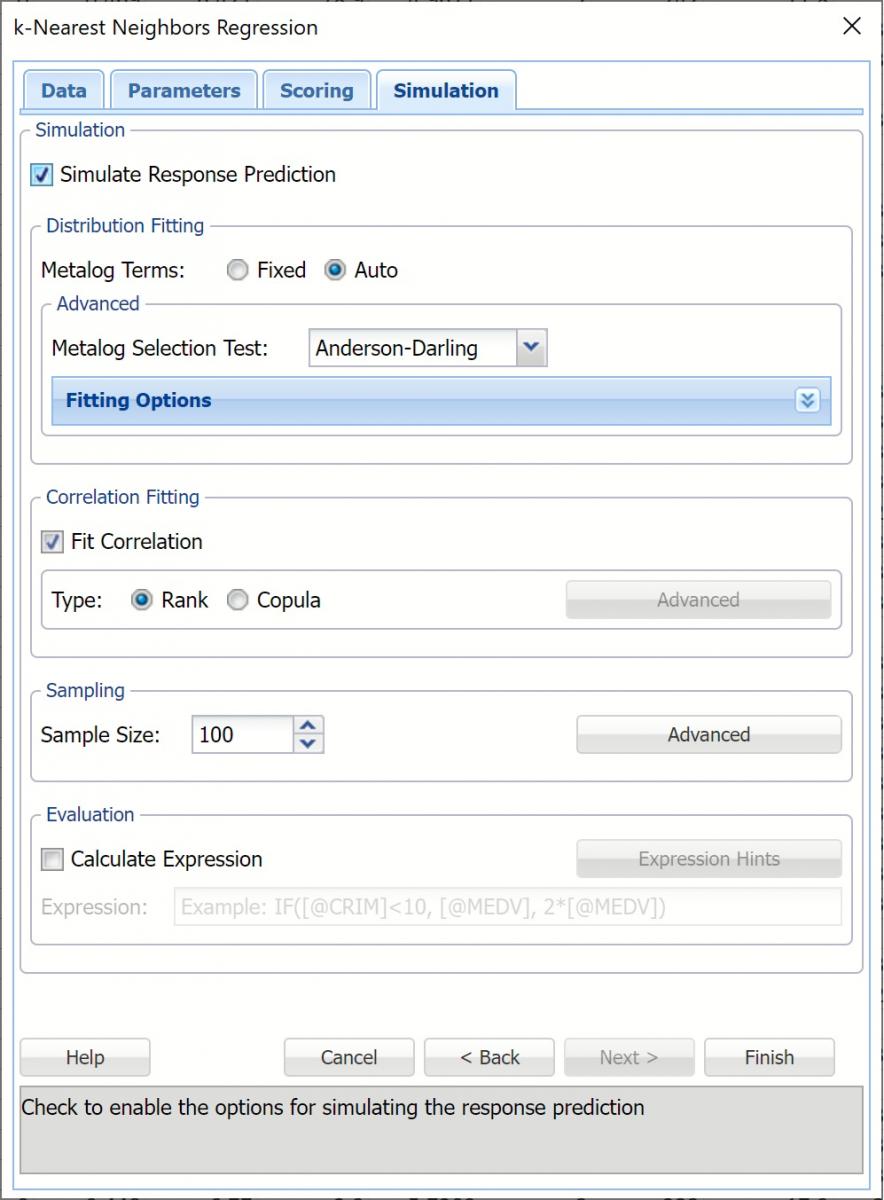
All supervised algorithms in V2023 include a new Simulation tab. This tab uses the functionality from the Generate Data feature (described in an earlier topic) to generate synthetic data based on the training partition, and uses the fitted model to produce predictions for the synthetic data. The resulting report, KNNP_Simulation, will contain the synthetic data, the predicted values and the Excel-calculated Expression column, if present. In addition, frequency charts containing the Predicted, Training, and Expression (if present) sources or a combination of any pair may be viewed, if the charts are of the same type.
Evaluation: Select Calculate Expression to amend an Expression column onto the frequency chart displayed on the KNNP_Simulation output tab. Expression can be any valid Excel formula that references a variable and the response as [@COLUMN_NAME]. Click the Expression Hints button for more information on entering an expression.