Analytic Solver Data Science™ is a comprehensive data science and machine learning add-in for Excel Desktop and Excel Online. Data science is a discovery-driven data analysis technology used for identifying patterns and relationships in data sets. With overwhelming amounts of data now available from transaction systems and external data sources, organizations are presented with increasing opportunities to understand their data and gain insights into it. Data science is still an emerging field, and is a convergence of fields like statistics, machine learning, and artificial intelligence.
Analytic Solver Data Science is a tool belt offering a variety of methods to analyze data. It has extensive coverage of statistical and machine-learning techniques for classification, prediction, affinity analysis, data exploration, and reduction.
In either Desktop Excel or Excel Online, click the Data Science tab to view the Analytic Solver Data Science icons.
For more information on how to insert our next-generation offering, Analytic Solver Cloud, download the Analytic Solver Data Science User Guide by clicking Support - Data Science Help.
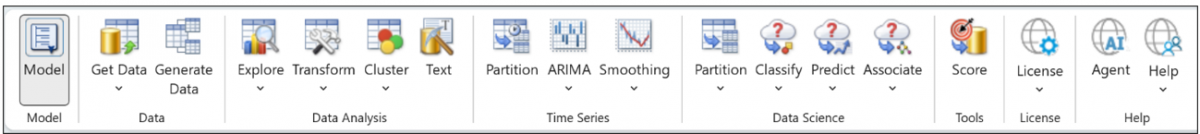
Data Science Desktop Ribbon
Data Science Cloud Ribbon
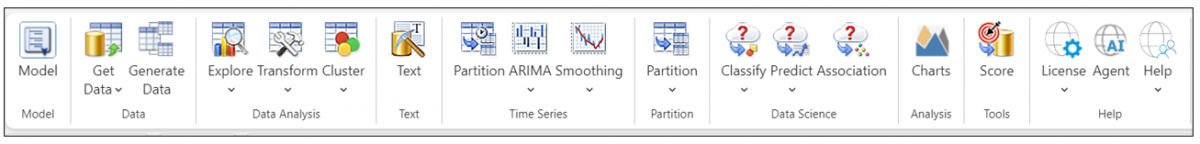
The Analytic Solver Data Science ribbon is divided into eight tabs: Model, Data, Data Analysis, Time Series, Data Science, Tools, License and Help.
Model - Click the Model button to display the Solver Task Pane. This feature allows you to quickly navigate through datasets and worksheets containing Analytic Solver Data Science results.
Data - Click the Get Data button to draw a random sample of data, or summarize data from a (i) an Excel worksheet, (ii) the PowerPivot “spreadsheet data model” which can hold 10 to 100 million rows of data in Excel, (iii) an external SQL database such as Oracle, DB2 or SQL Server, or (iv) a dataset with up to billions of rows, stored across many hard disks in an external Big Data compute cluster running Apache Spark (https://spark.apache.org/).
Data Analysis - You can use the Data Analysis group of buttons to explore your data, both visually and through methods like cluster analysis, transform your data with methods like Principal Components, Missing Value imputation, Binning continuous data, and Transforming categorical data, or use the Text Mining feature to extract information from text documents.
Time Series - Use the Time Series group of buttons for time series forecasting, using both Exponential Smoothing (including Holt-Winters) and ARIMA (Auto-Regressive Integrated Moving Average) models, the two most popular time series forecasting methods from classical statistics. These methods forecast a single data series forward in time.
Data Science - The Data Science group of buttons give you access to a broad range of methods for prediction, classification and affinity analysis, from both classical statistics and data science. These methods use multiple input variables to predict an outcome variable or classify the outcome into one of several categories. Analytic Solver Data Science and now the Data Science Cloud app, offer Ensemble Methods for use with Classification Trees, Regression Trees, and Neural Networks.
Tools - Use the Score button to score new data using a fitted forecasting, classification or prediction model.
License - Use this tab to login/logout of Analytic Solver and to view your licenses.
Help -Click the Help button to gain access to product documentation, over 100 example models, an extensive knowledge base as well as tutorials and webinars.