Finally, we'll build a predictive model for the tip level (above or below 20%), similar to the one in Joze Mazo’s Github thesis, based on the fare data. The thesis used the "Random Forests" algorithm, a widely used ensemble method where the so-called "weak learners" may be Classification and Regression Trees (hence the acronym CaRT). This algorithm can also be used in XLMiner, by simply selecting from the dropdown menu. (XLMiner refers to the algorithm as "Random Trees," because "Random Forests" is a trademark of Salford Systems.)
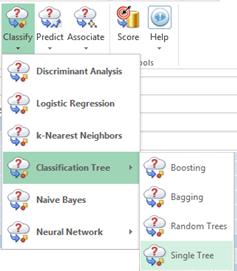
We'll begin by fitting a single Classification Tree to the data, then use an ensemble of 50 Classification Trees to see if that can improve results. In XLMiner we simply point and click to select the variables or features we'll use. Our target variable will be the tip_binary column, which is 1 when the tip percentage is >= 20% and 0 otherwise -- this matches the GitHub thesis. We'll include the following features -- this mix of ordinal and continuous variables can be used without further processing or encoding in XLMiner:

Unlike the GitHub thesis, we won’t include the fare_amount, mta_tax, or surcharge variables, since they are directly involved in computing the target variable (tip%).
Before fitting the Classification Tree (or during the process, using XLMiner's "partition on the fly" feature), we partition our data, which consists of 44,404 records, into 3 subsets:
- Training Set – 50% - 22,202
- Validation Set – 30% - 13,321
- Test Set – 20% - 8,881
XLMiner will use the Training Set to "grow" the full tree, then use the Validation Set to prune that tree, to minimize the chance of overfitting. It will then evaluate performance of the pruned tree on the Test Set. In just a few seconds, we get a summary of performance in an Excel worksheet (in XLMiner.com, we see the same results in a web browser, and can download them as an Excel workbook if desired.)
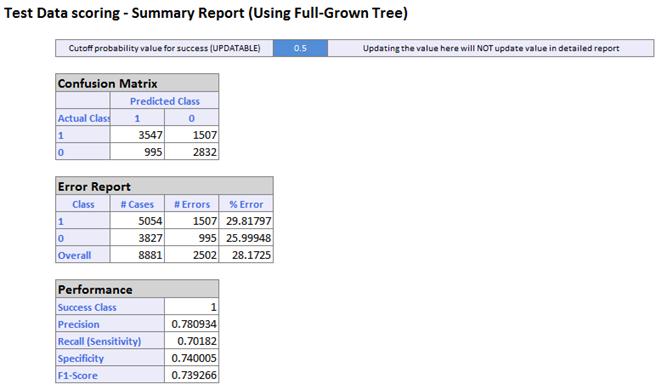
The model's accuracy or precision is 78%, slightly better than the GitHub thesis. The ROC curve gives us a quick visual idea of the model's predictive performance:
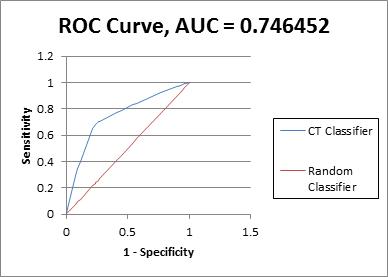
Next, we see whether an ensemble of 50 Classification Trees, built via the "Random Forests" algorithm, can improve performance. In XLMiner this is simply a matter of selecting Classification Tree - Random Trees in the dropdown menu above. XLMiner remembers our data partitions and variable selections, and prompts us to choose ensemble options. Again it takes just a few seconds to fit and combine 50 different trees or "weak learners". But we find that, in this case, the ensemble is not really better than the single tree.
Let's look at the Classification Tree diagram produced by XLMiner. We notice that the model doesn't use information about the number of passengers, but it derives predictive power from the vendor ID (CMT or VTS), trip time and distance, pickup and dropoff locations. and other attributes. This makes sense, according to our initial exploratory analysis and visualizations, and serves as a great starting point (since any model can be further improved).
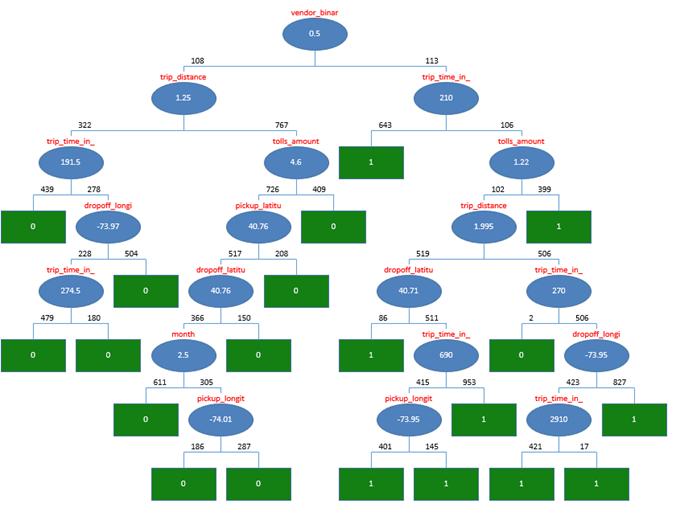
Despite limiting ourselves to a 0.05% sample of the full data set (we could have easily used more), our model's performance is similar to (slightly better than) the Random Forests model fitted to a month of data in the GitHub thesis. We've shown that a random sample drawn from the massive NYC Taxi dataset has preserved enough statistical properties of the full data to lead us to a model with essentially identical predictive power.
More important, this kind of analysis can be done quite easily, point and click, by any business analyst who can use Excel, or simply use a web browser and XLMiner.com. No programming is required! And even in Excel, effective analysis of a company's Big Data assets -- formerly available only to the ‘elite’ IT professionals and Data Scientists -- is not only possible, but easy with XLMiner and Apache Spark.
You can do this on your own PC if you have Analytic Solver Platform or XLMiner V2015-R2 or later -- if you're registered and logged in on Solver.com, you can download a free trial here. Faculty members teaching MBA students with our software are invited to contact us about access to Frontline's Apache Spark Big Data cluster on Amazon Web Services, where this and other example datasets are pre-loaded.