On the Data Science ribbon, select Classify - Naive Bayes to open the Naive Bayes - Step 1 of 3 dialog. Following are descriptions of the options available from the three Naive Bayes dialogs.
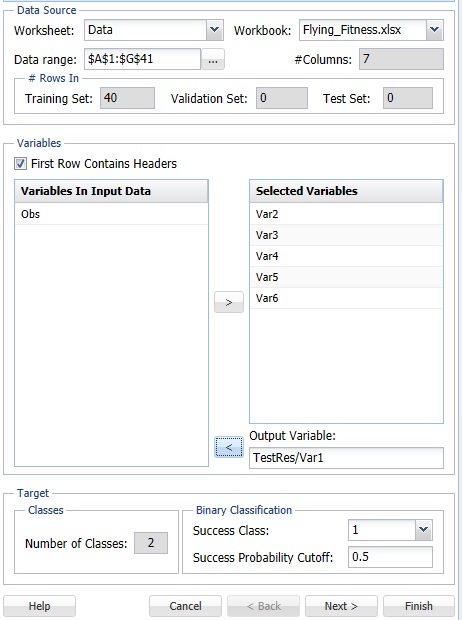
Variables In Input Data
The variables included in the data set appear here.
Selected Variables
Variables selected to be included in the output appear here.
Output Variable
The dependent variable or the variable to be classified appears here.
# Classes
Displays the number of classes in the Output variable.
Specify "Success" class (for Lift Chart)
This option is selected by default. Click the drop-down arrow to select the value to specify a success. This option is enabled when the number of classes for the output variable is equal to 2.
Specify initial cutoff probability for success
Enter a value between 0 and 1 here to denote the cutoff probability for success. If the calculated probability for success for an observation is greater than or equal to this value, than a success (1) will be predicted for that observation. If the calculated probability for success for an observation is less than this value, then a non-success (0) will be predicted for that observation. The default value is 0.5. This option is enabled when the number of classes for the output variable is equal to 2.
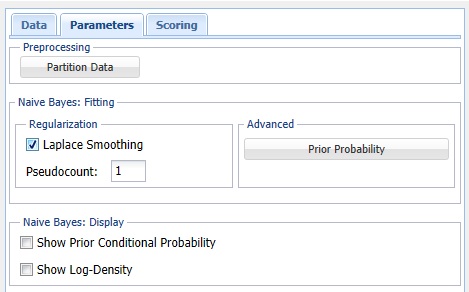
Partition Data
Analytic Solver Data Science includes the ability to partition a dataset from within a classification or prediction method by clicking Partition Data on the Parameters dialog. If this option is selected, Analytic Solver Data Science will partition your dataset (according to the partition options you set) immediately before running the classification method. If partitioning has already occurred on the dataset, this option will be disabled. For more information on partitioning, please see the Data Science Partitioning chapter.
Prior Probability
Click Prior Probability. Three options appear in the Prior Probability Dialog: Empirical, Uniform and Manual.
If the first option is selected, Empirical, Analytic Solver Data Science will assume that the probability of encountering a particular class in the dataset is the same as the frequency with which it occurs in the training data.
If the second option is selected, Uniform, Analytic Solver Data Science will assume that all classes occur with equal probability.
Select the third option, Manual, to manually enter the desired class and probability value.
Laplace Smoothing
If a particular realization of some feature never occurs in a given class in the training partition, then the corresponding frequency-based prior conditional probability estimate will be zero. For example, assume that you have trained a model to classify emails using the Naïve Bayes Classifier with 2 classes: work and personal. Assume that the model rates one email as having a high probability of belonging to the "personal" class. Now assume that there is a 2nd email that is the same as the previous email, but this email includes one word that is different. Now, if this one word was not present in any of the “personal” emails in the training partition, the estimated probability would be zero. Consequently, the resulting product of all probabilities will be zero, leading to a loss of all the strong evidence of this email to belong to a “personal” class. To mitigate this problem, Analytic Solver Data Science allows you to specify a small correction value, known as a pseudocount, so that no probability estimate is ever set to 0. Normalizing the Naïve Bayes classifier in this way is called Laplace smoothing. Pseudocount set to zero is equivalent to no smoothing. There are arguments in the literature which support a pseudocount value of 1, although in practice, fractional values are often used. When Laplace Smoothing is selected, Analytic Solver Data Science will accept any positive value for pseudocount.
Show Prior Conditional Probability
Select this option to print Prior Conditional Probability for the training partition in the output.
Show Log-Density
Select this option to print the Log-Density values for each partition in the output. Log PDF, or Logarithm of Unconditional Probability Density, is the distribution of the predictors marginalized over the classes and is computed using:
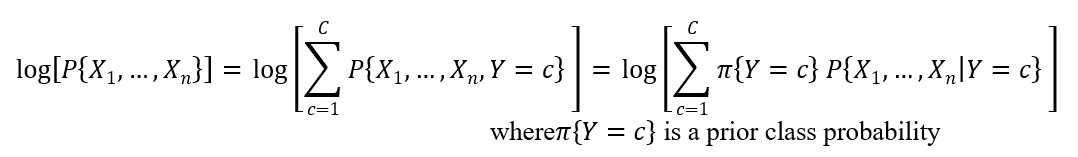
where πY=c is a prior class probability
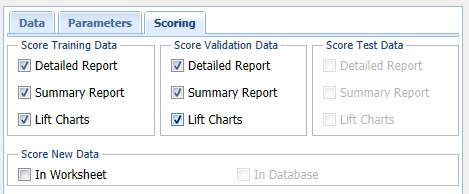
Score Training Data
Select these options to show an assessment of the performance of the tree in classifying the Training Set. The report is displayed according to the specifications: Detailed, Summary, and Lift Charts. Lift Charts are only available when the Output Variable has two classes.
Score Validation Data
These options are enabled when a Validation Set is present. Select these options to show an assessment of the performance of the tree in classifying the Validation Data. The report is displayed according to your specifications - Detailed, Summary, and Lift charts. Lift charts are only available when the Output Variable has two classes.
Score Test Data
These options are enabled when a test data set is present. Select these options to show an assessment of the performance of the tree in classifying the test data. The report is displayed according to the specifications: Detailed, Summary, and Lift Charts. Lift Charts are only available when the Output Variable has two classes.
Score New Data
See the Scoring New Data section for information on the Score New Data options.