We've just released Analytic Solver® V2023 Q2 (desktop and cloud versions) -- a new version of our product line for Excel, that we highly recommend for all users. We've also released a new version of Solver SDK®, our "callable library" product for developers creating desktop and server apps -- now available for both Windows and Linux -- and a new version of RASON®, our Azure-based cloud service that makes it easy for just about anyone to use optimization, simulation, and data science and machine learning in a Web or mobile app.
Easily Run Your @RISK Model in the Cloud
@RISK is an Excel add-in for Monte Carlo simulation and risk analysis from Palisade Corp, now part of Lumivero. It has been quite popular among Excel users, but it's available only for Excel for Windows. So @RISK users have been limited to running their risk analysis models only on desktops or laptops.
Modern Excel comes in several, highly compatible versions: Excel for Windows, Excel for Macintosh, Excel for the Web (runs in a browser), and in Microsoft Teams (this is actually Excel for the Web). Analytic Solver -- including all its Monte Carlo simulation and risk analysis features -- runs in all these Excel versions, and includes "point and click" deployment of live models to Power BI and Tableau. But in the past, it has taken some work for users to convert their @RISK models to Analytic Solver.
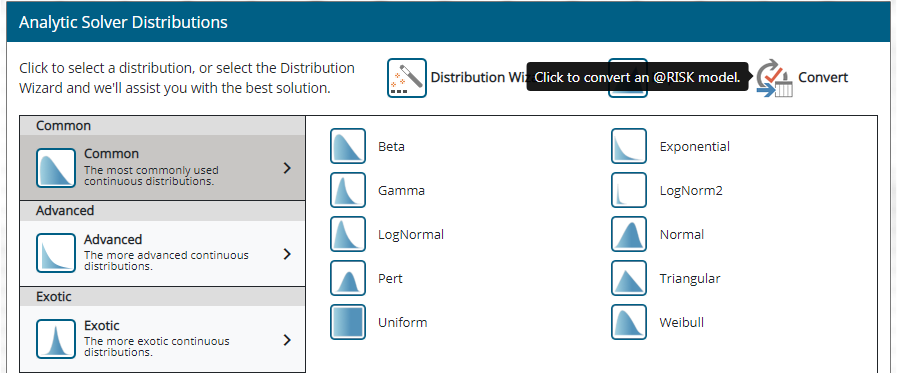
Not anymore: Just start Excel with Analytic Solver, open your @RISK model workbook, click Distributions - Convert on the Analytic Solver Ribbon, and voila! ... your @RISK model is now an Analytic Solver model. Save your workbook, then open it in any of the other modern Excel versions -- it just works. (In platforms other than desktop Windows, you do need a one-time step: Use Excel's Insert - Office Add-ins option to add Analytic Solver to your workbooks.)
Click the Deploy Model button on the Ribbon, choose Teams, Power BI or Tableau, and with a few mouse clicks, see your @RISK model running live in these tools. And with the Solver SDK and Cloud Service options, you can create the core of your own desktop / server, web or mobile application that runs your @RISK model (well, now your Analytic Solver Simulation model).
This works for (at least) 163 @RISK probability distribution functions, Statistics and Six Sigma functions, Time Series simulation functions, and "property functions". The conversion process automatically handles distributions, rank-order correlation matrices and copulas, and time series; we've generalized Analytic Solver's PSI functions to handle the @RISK forms of arguments. There will certainly be some "edge cases" not covered in this release -- please let us know, we're already planning a point release for those cases! But we've converted and tested hundreds of @RISK models, including Excel workbooks with literally thousands of @RISK function calls.
Data Mining tab: Analyze and Chart Data, or Generate Synthetic Data
In the data science and machine learning portion of Analytic Solver -- the Data Mining tab on the Ribbon, available to all users -- you'll find several powerful tools that apply Monte Carlo simulation methods, as well as charting like you find in @RISK or Analytic Solver Simulation, to analyze data that you've brought into Excel from other sources. You simply need data in columns and rows, where observations, cases, or trials appear in the rows, and variables, attributes or features appear in the columns.
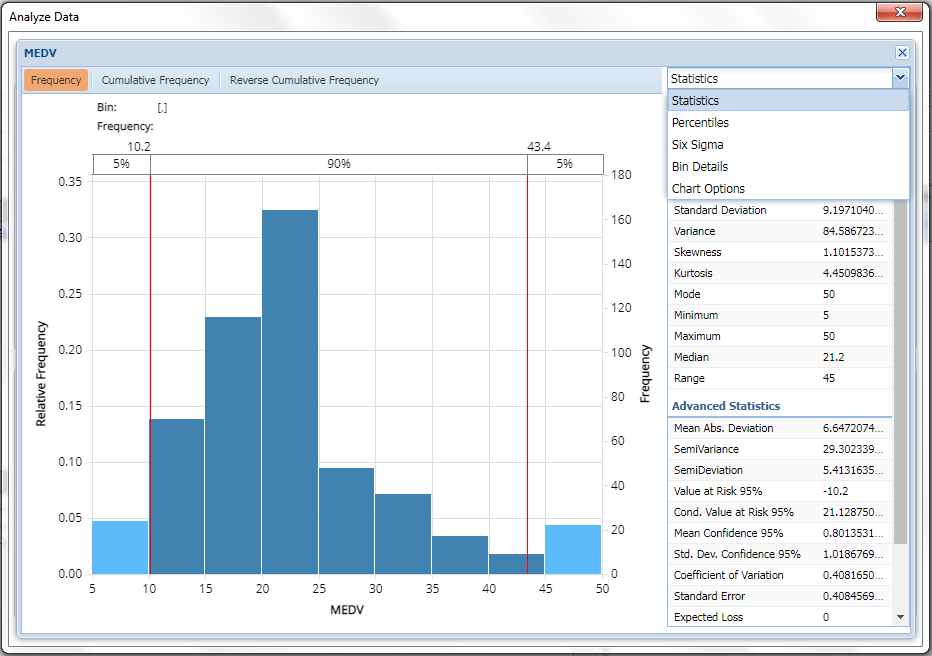
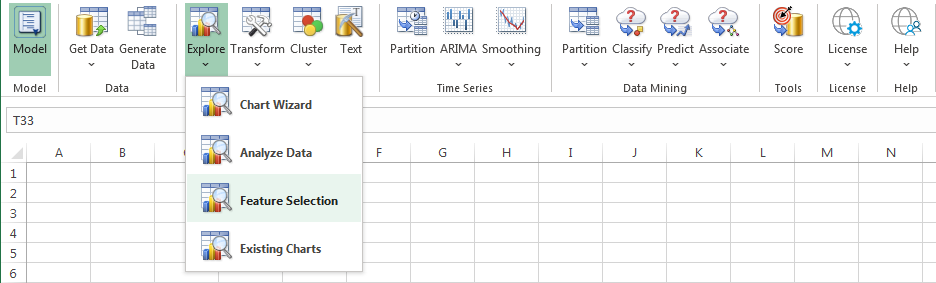
From the Analytic Solver Explore button, pick the dropdown menu Analyze Data -- then choose the features / columns you want to analyze, and click Finish. You'll see a new worksheet "Statistics" with an array of charts -- click one to see results much like you see in @RISK or Analytic Solver Simulation -- or check the worksheet for full tables of statistics and risk measures, Six Sigma functions, and percentiles. The example below reflects median (1978) home prices by census tract in the classic "Boston Housing" dataset.
If your data includes a goal or "predicted output" column, choose Explore - Feature Selection to allow Analytic Solver to determine for you which features / columns have the most explanatory or predictive power for your desired output.
To visualize your data in some new ways not available in Excel charts, try Explore - Chart Wizard. This tool -- rewritten for V2023 Q2 using JavaScript and D3, so it works uniformly in both desktop Excel and Excel for the Web -- lets you quickly create a chart of all Variables (attributes or features), create Histograms, Parallel Coordinates and Scatterplot Matrix charts, and quickly create (and filter data in) some standard chart types like Bar Charts, Line Charts, Scatterplots and Box-Whisker plots.
And for something new and exciting -- especially if you've heard all the hype about synthetic data generation as a form of "Generative AI" -- just click the Generate Data button on the Data Mining Ribbon. A number of startup companies are getting attention because (all) they offer is synthetic data generation -- but you already have it in Analytic Solver, Solver SDK and RASON. (We introduced this capability 8 months ago in our first V2023 release -- read more here.) Simply select the columns or features for which you want to generate synthetic data in the first dialog -- the default options are fine, but you can customize them on the Parameters tab.
Under the Hood: New, Higher Performance Machine Learning Algorithms
Each new Analytic Solver release also includes a lot of algorithm and code changes that don't result in any new menu options, dialogs or visible features, but do result in greater power to solve problems. In Analytic Solver V2023 Q2, we've completely rewritten virtually all of the machine learning algorithms that underlie the menu choices under Classify and Predict -- from Linear and Logistic Regression to k-Nearest Neighbors, Neural Networks, and Classification and Regression Trees, as well as Ensembles of these, and the fully-automated Find Best Model menu option. Why? We do this partly for ourselves, to turn so-called "technical debt" into "technical advantage", but mostly for you -- to deliver greater problem-solving power.
And of course, in this release we've fixed bugs and issues that users have reported to us via Technical Support, and issues that we've discovered ourselves. We believe Analytic Solver V2023 Q2 is our best release ever, and we hope you enjoy it! For use with desktop Excel, just login and click the Download main menu option to download and run the latest SolverSetup program. For Analytic Solver Cloud version on the Mac, in the browser, or in Microsoft Teams, you don't have to do anything -- V2023 Q2 is immediately available to all users.