We've just released Analytic Solver V2025 Q4, with new versions of Analytic Solver Desktop and Cloud (for Excel users), Solver SDK (for developers), and our cloud platform RASON. In this release, we’ve focused on ease of use and better support for model creation. Most prominent is the new AI Agent tab in the Task Pane, which appears (in lieu of the Model tab) when you visit Analytic Solver on the Ribbon.
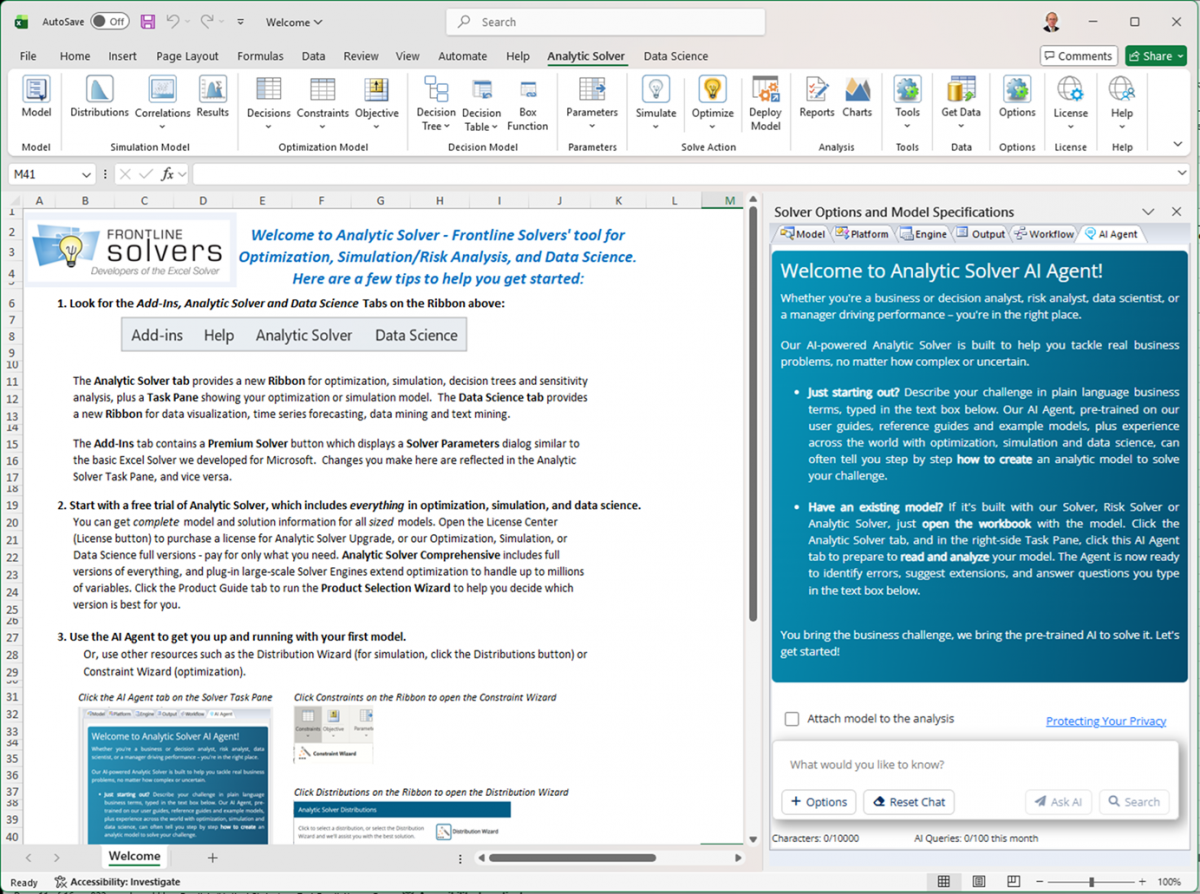
AI Agent: Greater Expertise, Much Easier to Use
The AI Agent’s ability to help you build a model in the first place is greatly improved in this release. You can type in plain language what you want to accomplish: For example “My company produces material in large sheets, that we need to cut into smaller sizes that our customers need. We’d like to do this while minimizing waste.” The AI Agent can recognize this as a “cutting stock optimization problem”, tell you how to formulate a model with the right variables and constraints, advise you what data you’ll need, and give you link(s) to example model(s) relevant to what you’re trying to accomplish.
You can also use the AI Agent to diagnose a model that you’ve previously created – looking for missing elements, possible errors, and suggested enhancements. Just open your model workbook, then go to the AI Agent tab in the Task Pane.
Semantic Search Without Using AI
Some customers are uncomfortable with the idea that an external agent like ChatGPT-5 might “read and understand” their model. If that’s your situation, you can still use the Search button (instead of the Ask AI button) at the bottom of the AI Agent tab. This performs a semantic search (much better than just searching for keyword matches) across all 3,500 pages of Frontline’s User and Reference Guides, and our hundreds of example models. It’s also much faster than “Ask AI”.
A Shorter Ribbon, and Other Simplifications
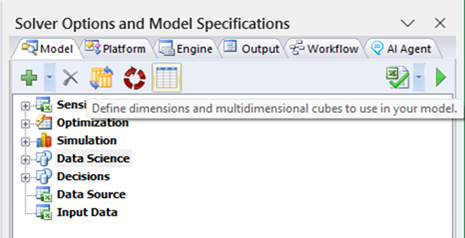
Note that, with the AI Agent “up front” in the Task Pane, we no longer need the AI Assist and Ask Question icons on the Ribbon. We’ve also moved the Dimensional Modeling icon from the Ribbon to the Task Pane Model tab, where we’ve also placed the Reset All icon (in red):
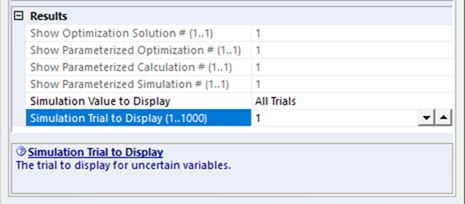
And we’ve removed the Tools tab from the Task Pane: The controls allowing you to select (and display on the worksheet) specific Simulation Trials, or specific runs from multiple parameterized Simulations or Optimizations, are now – more conveniently – available at the bottom of the Output tab:
Easier to Find Distribution Fitting
In this release, we’ve swapped the positions of two popular features, based on customer feedback about where they expected to find them.
If you’re defining probability distributions, and you have sample data that you’d like to fit to a well-known type of distribution, you’ll find a Fit Data icon at the top of the main Distributions dialog, displayed when you click the Distributions icon on the Ribbon:
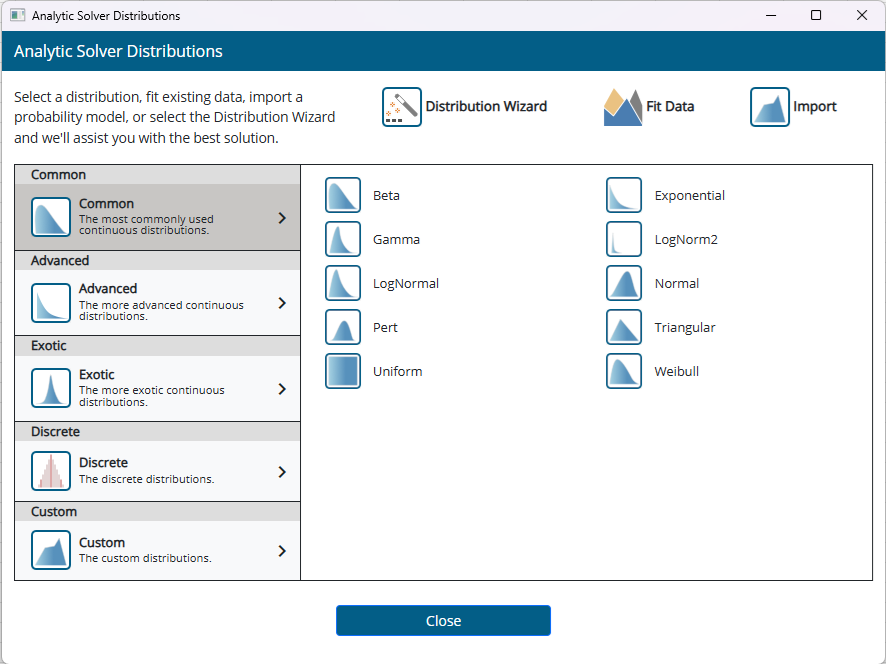
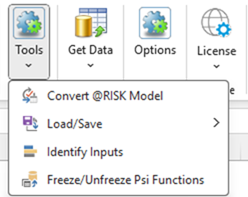
Fit Data (formerly available via the Tools icon, now here) replaces another popular feature, Convert @RISK Model. This option (which you’ll need only once, if at all) is now available via the Tools icon.
Easier to Find “LP or MPS Model Format”
Another popular feature formerly available under the Tools icon, often used to help “debug” linear or linear mixed-integer programming models, allow you to write out your model as an “LP format file”. This is a text file where every constraint is written in “algebraic linear coefficient form”. An older and even more basic file format, called a “MPS format file”, can also be written out.
From customer feedback, we concluded that this feature belonged with our full array of model deployment features, accessible in the dialog that appears for the Deploy Model icon (it's the last option below, Save to File):
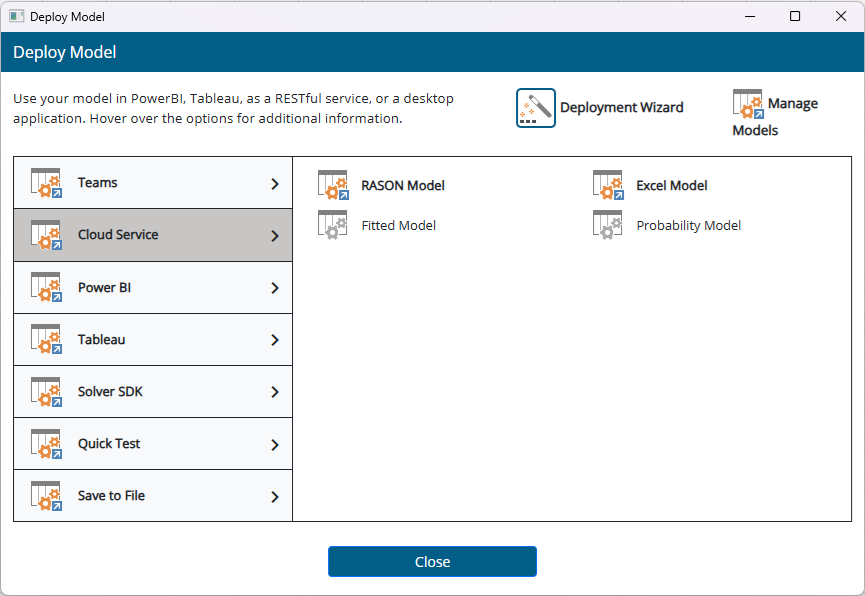
If you haven’t previously focused on the Deploy Model dialog, we encourage you to spend some time here: It’s the easy way to share your model results, or even your full solvable model, with others in your company, using Microsoft Teams, Power BI or Tableau, or our RASON Cloud Service.
With a few mouse clicks, you can turn your Excel model into a visual working model on your Power BI or Tableau dashboard – or even turn it into a “cloud service” readily usable from other web or mobile apps. If you’re not sure, just click the Deployment Wizard icon at the top of the dialog!