Model Pane
RASON Desktop User Guide
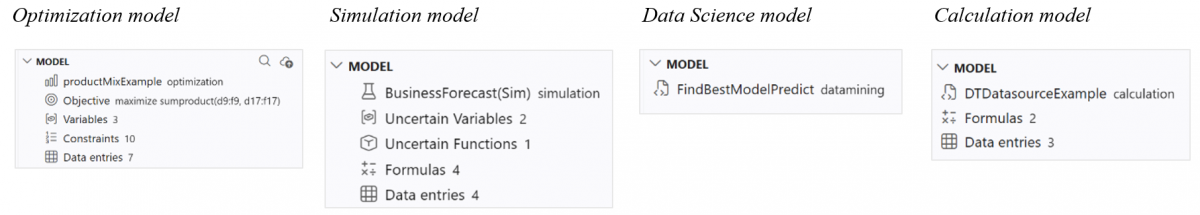
Model Summary
The top of the pane summarizes the model as it is currently defined. Each row reflects a section of the RASON model and updates automatically as the model is edited.
| Node | Applies to | Description |
|---|---|---|
| Model Name | Any | The root node shows the model name and the model type (optimization, simulation, calculation, or datamining). |
| Objective | Opt | Displays the objective formula and its sense for an optimization model. |
| Variables | Opt | The number of decision variables defined in the optimization model. |
| Constraints | Opt | The number of constraints defined in the optimization model. |
| Uncertain Variables | Sim | The number of uncertain variables defined in the simulation model. |
| Uncertain Functions | Sim | The number of uncertain functions defined in the simulation model. |
| Data entries | Any | The number of data objects or arrays defined in the data section of any model type. |
| Formulas | Any | The number of intermediate formulas defined in the formulas section of any model type. |
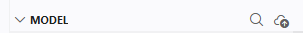
Export Model and Diagnose Model Buttons
Two buttons in the RASON Desktop interface act on the currently open model: Export Model sends the model to Power BI or Excel, and Diagnose Model runs the diagnosis that populates the Diagnosis Results branch described below.
- Export Model — Exports the open RASON model so it can be run outside Visual Studio Code. Click Export Model, then choose Export to Power BI or Export to Excel at the top of the screen. After the export succeeds, a confirmation message appears in Visual Studio Code, and the model can be executed directly within the chosen application, letting you run it and explore scenarios without returning to the editor.
- Diagnose Model — Runs a diagnosis of the open model, classifying it and reporting the characteristics that determine which Solver engine can be used. The results appear under the Diagnosis Results branch of the Model pane.
Note: Exporting to Power BI or Excel requires RASON Runner to be installed, which adds Solve under External Tools in Power BI and the RASON tab in Excel.
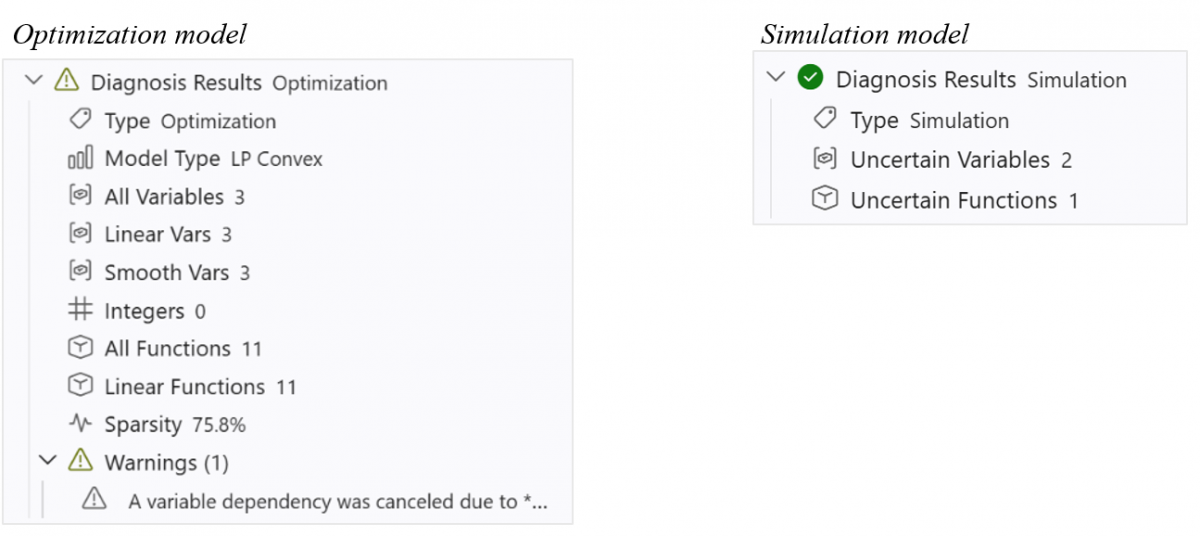
Diagnosis Results
The Diagnosis Results branch appears after a model diagnosis is performed on an optimization or simulation model (only). Diagnosis classifies the model and reports the characteristics that determine which Solver engine can be used.
Applies to: Optimization Simulation
| Node | Applies to | Description |
|---|---|---|
| Type | Opt Sim | The problem class identified by the diagnosis. |
| Model Type | Opt | The diagnosed structure of an optimization model. This field does not appear for simulation models. LP Convex indicates a linear, convex program, which can be solved by the fast and reliable linear programming engine. Other classifications for optimization models include LP/MIP, QP, NLP, and Non-Convex. |
| Variables | Opt | The total count of decision variables in the optimization model seen by the diagnosis. |
| Linear Vars | Opt | The number of variables that appear in the optimization model, only in linear terms. |
| Smooth Vars | Opt | The number of variables that appear in smooth (continuous, differentiable) nonlinear functions, in the optimization model. |
| Integers | Opt | The number of variables constrained to integer values in the optimization model. |
| All Functions | Opt | The total number of functions in the optimization model, counting the objective and all constraints. |
| Linear Functions | Opt | The number of those functions that are linear. When this equals All Functions, the model is fully linear. (Optimization models only.) |
| Sparsity | Opt | The percentage of zero coefficients in the model’s coefficient matrix. Higher sparsity generally allows faster solves. (Optimization models only.) |
| Uncertain Variables | Sim | The number of uncertain variables appearing in the simulation model. |
| Uncertain Functions | Sim | The number of uncertain functions appearing in the simulation model. |
| Warnings (n) | Opt Sim | An expandable branch listing any warnings raised during diagnosis. The number in parentheses is the warning count. |
Note: The Diagnosis Results and Warnings branches are only shown after a diagnosis has been run. Before diagnosis, the pane displays the model summary only.