Following are descriptions of the options on the five Logistic Regression dialogs.
Logistic Regression Dialog, Data Tab
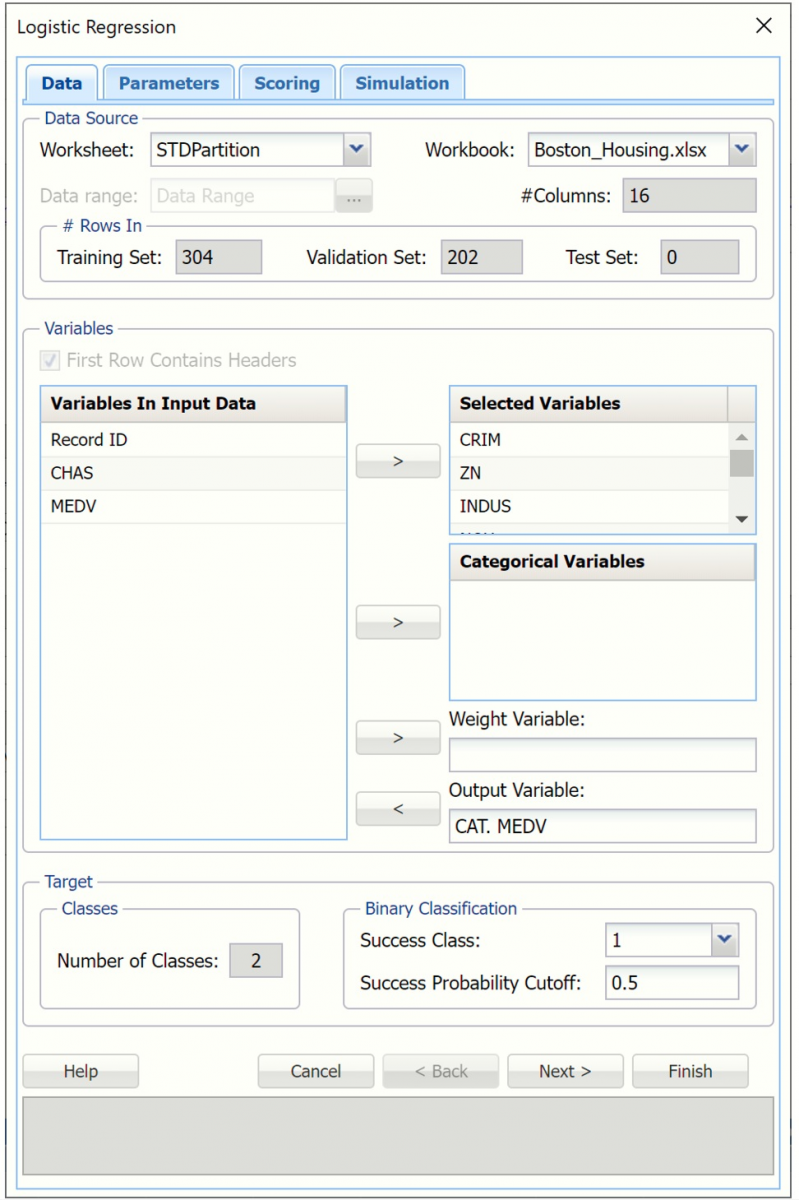
Variables In Input Data
All variables in the dataset are listed here.
Selected Variables
Variables listed here will be utilized in the Analytic Solver Data Science output.
Weight Variable
One major assumption of Logistic Regression is that each observation provides equal information. Analytic Solver Data Science offers an opportunity to provide a Weight variable. Using a Weight variable allows the user to allocate a weight to each record. A record with a large weight will influence the model more than a record with a smaller weight.
Output Variable
Select the variable whose outcome is to be predicted. The classes in the output variable must be equal to 2.
Number of Classes
Displays the number of classes in the Output Variable.
Success Class
This option is selected by default. Click the drop down arrow to select the value to specify a "success". This option is enabled when the number of classes for the output variable is equal to 2.
Success Probability Cutoff
Enter a value between 0 and 1 here to denote the cutoff probability for success. If the calculated probability for success for an observation is greater than or equal to this value, than a "success" or a 1 will be predicted for that observation. If the calculated probability for success for an observation is less than this value, then a "non-success" or a 0 will be predicted for that observation. The default value is 0.5. This option is enabled when the number of classes for the output variable is equal to 2.
Logistic Regression Dialog, Parameters Tab
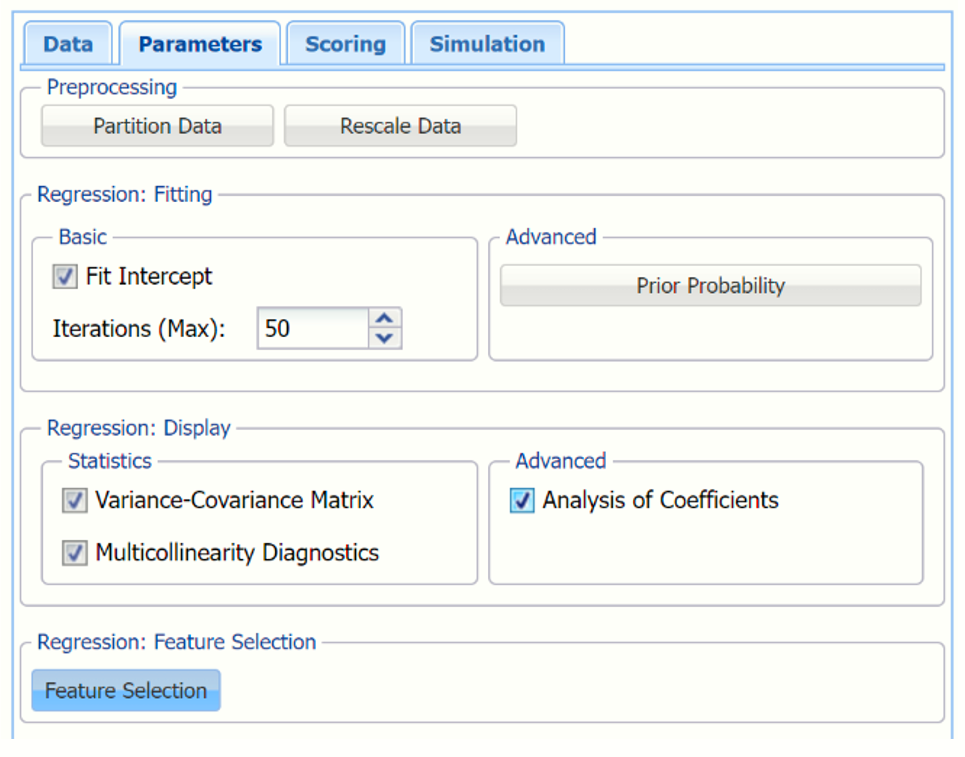 Partition Data
Analytic Solver Data Science includes the ability to partition a dataset from within a classification or prediction method by clicking Partition Data on the Parameters dialog. Analytic Solver Data Science will partition your dataset (according to the partition options you set) immediately before running the classification method. If partitioning has already occurred on the dataset, this option will be disabled. For more information on partitioning, please see the Data Science Partitioning chapter.
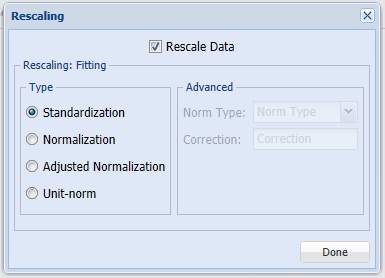 Rescale Data
Click Rescale Data, to open the Rescaling Dialog. Use Rescaling to normalize one or more features in your data during the data preprocessing stage. Analytic Solver Data Science provides the following methods for feature scaling: Standardization, Normalization, Adjusted Normalization and Unit Norm. For more information on this new feature, see the Rescale Continuous Data section within the Transform Continuous Data chapter that occurs earlier in this guide.
Prior Probability
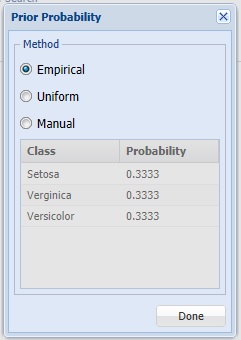
Click Prior Probability to open the dialog below. Three options appear in the Prior Probability Dialog: Empirical, Uniform and Manual.
If the first option is selected, Empirical, Analytic Solver Data Science will assume that the probability of encountering a particular class in the dataset is the same as the frequency with which it occurs in the training data.
If the second option is selected, Uniform, Analytic Solver Data Science will assume that all classes occur with equal probability.
Select the third option, Manual, to manually enter the desired class probability value.
Fit Intercept
When this option is selected, the default setting, Analytic Solver Data Science will fit the Logistic Regression intercept. If this option is not selected, Analytic Solver Data Science will force the intercept term to 0.
Iterations (Max)
Estimating the coefficients in the Logistic Regression algorithm requires an iterative non-linear maximization procedure. You can specify a maximum number of iterations to prevent the program from getting lost in very lengthy iterative loops. This value must be an integer greater than 0 or less than or equal to 100 (1< value <= 100).
Variance - Covariance Matrix
When this option is selected, Analytic Solver Data Science will display the coefficient covariance matrix in the output. Entries in the matrix are the covariances between the indicated coefficients. The “on-diagonal” values are the estimated variances of the corresponding coefficients.
Multicollinearity Diagnostics
At times, variables can be highly correlated with one another which can result in large standard errors for the affected coefficients. Analytic Solver Data Science will display information useful in dealing with this problem if Multicollinearity Diagnostics is selected.
Analysis of Coefficients
When this option is selected, Analytic Solver Data Science will produce a table with all coefficient information such as the Estimate, Odds, Standard Error, etc. When this option is not selected, Analytic Solver Data Science will only print the Estimates.
Feature Selection
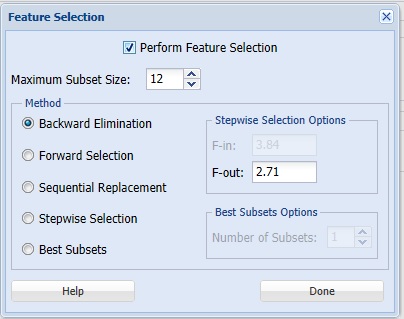
When you have a large number of predictors and you would like to limit the model to only the significant variables, click Feature Selection to open the Feature Selection dialog and select Perform Feature Selection at the top of the dialog.
Maximum Subset Size can take on values of 1 up to N where N is the number of Selected Variables. If no Categorical Variables exist, the default for this option is N. If one or more Categorical Variables exist, the default is "15".
Note: Use some caution when setting this option to a low value, especially if your model contains categorical variables. If the number of total features (continuous variables + encoded categorical variables) is substantially larger than this option setting, then this feature will filter out all subsets (resulting in a blank Feature Selection table). If you notice a blank table in your results, increase the setting for this option.
Analytic Solver Data Science offers five different selection procedures for selecting the best subset of variables.
- Backward Elimination in which variables are eliminated one at a time, starting with the least significant. If this procedure is selected, FOUT is enabled. A statistic is calculated when variables are eliminated. For a variable to leave the regression, the statistic's value must be less than the value of FOUT (default = 2.71).
- Forward Selection in which variables are added one at a time, starting with the most significant. If this procedure is selected, FIN is enabled. On each iteration of the Forward Selection procedure, each variable is examined for the eligibility to enter the model. The significance of variables is measured as a partial F-statistic. Given a model at a current iteration, we perform an F Test, testing the null hypothesis stating that the regression coefficient would be zero if added to the existing set if variables and an alternative hypothesis stating otherwise. Each variable is examined to find the one with the largest partial F-Statistic. The decision rule for adding this variable into a model is: Reject the null hypothesis if the F-Statistic for this variable exceeds the critical value chosen as a threshold for the F Test (FIN value), or Accept the null hypothesis if the F-Statistic for this variable is less than a threshold. If the null hypothesis is rejected, the variable is added to the model and selection continues in the same fashion, otherwise the procedure is terminated.
- Sequential Replacement in which variables are sequentially replaced and replacements that improve performance are retained. When this method is selected, the Stepwise selection options F-IN and F-OUT are disabled.
- Stepwise Selection is similar to Forward selection except that at each stage, Analytic Solver Data Science considers dropping variables that are not statistically significant. When this procedure is selected, the Stepwise selection options FIN and FOUT are enabled. In the stepwise selection procedure a statistic is calculated when variables are added or eliminated. For a variable to come into the regression, the statistic's value must be greater than the value for FIN (default = 3.84). For a variable to leave the regression, the statistic's value must be less than the value of FOUT (default = 2.71). The value for FIN must be greater than the value for FOUT.
- Best Subsets where searches of all combinations of variables are performed to observe which combination has the best fit. (This option can become quite time consuming depending on the number of input variables.) If this procedure is selected, Number of best subsets is enabled.
Logistic Regression Dialog, Scoring Tab
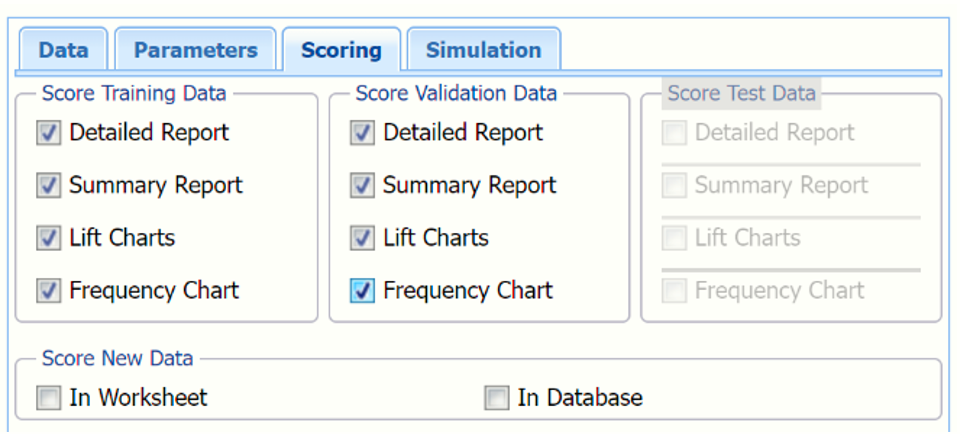
New in V2023: When Frequency Chart is selected, a frequency chart will be displayed when the LogReg_TrainingScore worksheet is selected. This chart will display an interactive application similar to the Analyze Data feature, explained in detail in the Analyze Data chapter that appears earlier in this guide. This chart will include frequency distributions of the actual and predicted responses individually, or side-by-side, depending on the user’s preference, as well as basic and advanced statistics for variables, percentiles, six sigma indices.
 Score Training Data
Select these options to show an assessment of the performance of the algorithm in classifying the training data. The report is displayed according to your specifications - Detailed, Summary, Lift charts and Frequency. Lift charts are only available when the Output Variable contains 2 categories.
Score Validation Data
These options are enabled when a validation dataset is present. Select these options to show an assessment of the performance of the algorithm in classifying the validation data. The report is displayed according to your specifications - Detailed, Summary, Lift charts and Frequency. Lift charts are only available when the Output Variable contains 2 categories.
Score Test Data
These options are enabled when a test dataset is present. Select these options to show an assessment of the performance of the algorithm in classifying the test data. The report is displayed according to your specifications - Detailed, Summary, Lift charts and Frequency. Lift charts are only available when the Output Variable contains 2 categories.
Score New Data
For information on scoring in a worksheet or database, please see the chapters “Scoring New Data” and “Scoring Test Data” in the Analytic Solver Data Science User Guide.
Logistic Regression Dialog, Simulation Tab
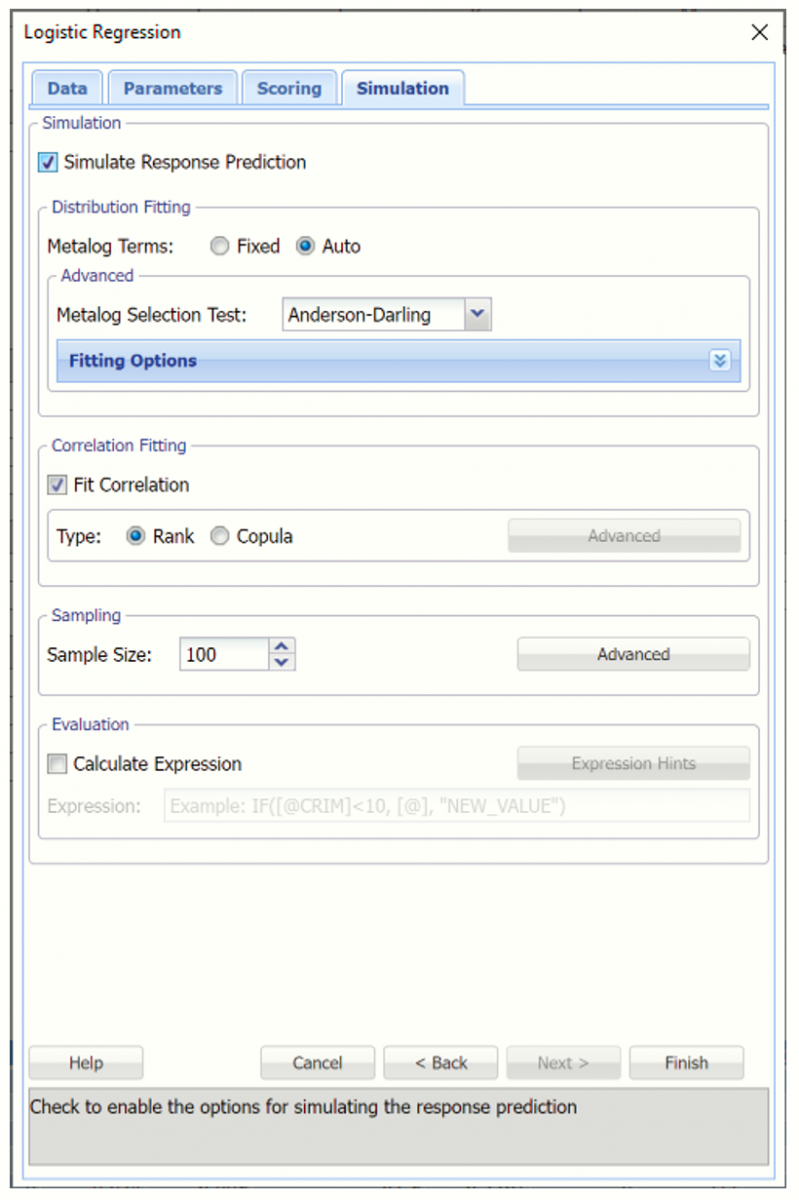
All supervised algorithms in V2023 include a new Simulation tab. This tab uses the functionality from the Generate Data feature (described earlier in this guide) to generate synthetic data based on the training partition, and uses the fitted model to produce predictions for the synthetic data. The resulting report,
LogReg_Simulation, will contain the synthetic data, the predicted values and the Excel-calculated Expression column, if present. In addition, frequency charts containing the Predicted, Training, and Expression (if present) sources or a combination of any pair may be viewed, if the charts are of the same type.
Evaluation: Select Calculate Expression to amend an Expression column onto the frequency chart displayed on the LogReg_Simulation output tab. Expression can be any valid Excel formula that references a variable and the response as [@COLUMN_NAME]. Click the Expression Hints button for more information on entering an expression.