Following are descriptions of options available on the Neural Network Classification dialogs.
Neural Network Classification dialog, Data tab
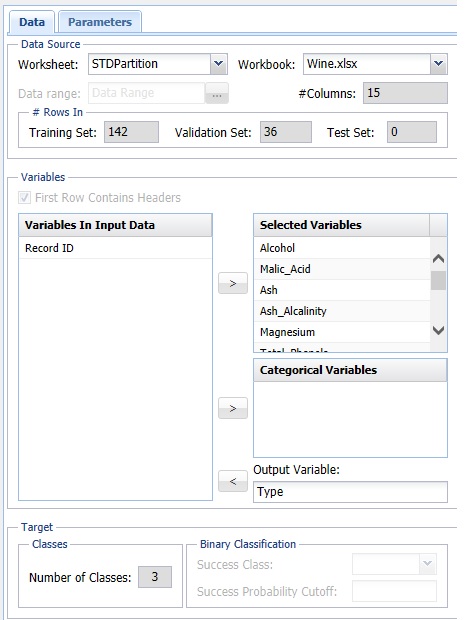
Variables In Input Data
The variables included in the data set appear here.
Selected Variables
Variables selected to be included in the output appear here.
Output Variable
The dependent variable or the variable to be classified appears here.
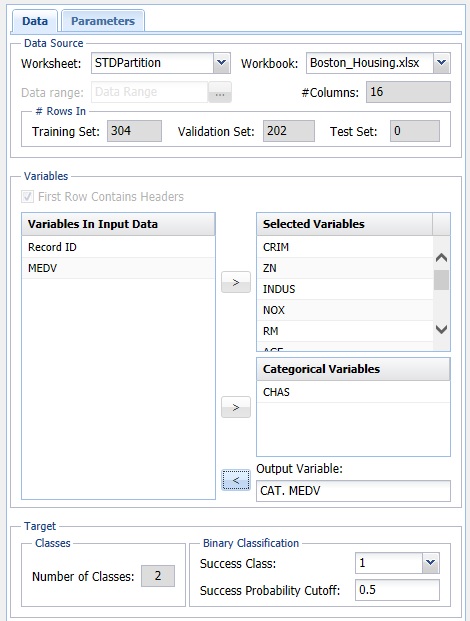
# Classes
Displays the number of classes in the Output Variable.
Specify "Success" class (for Lift Chart)
This option is selected by default. Click the drop-down arrow to select the value to specify a success. This option is enabled when the number of classes for the Output Variable is equal to 2.
Specify initial cutoff probability for success
Enter a value between 0 and 1 to denote the cutoff probability for success. If the calculated probability for success for an observation is greater than or equal to this value, than a success (1) will be predicted for that observation. If the calculated probability for success for an observation is less than this value, then a non-success (0) will be predicted for that observation. The default value is 0.5. This option is only enabled when the # Classes is equal to 2.
Neural Network Classification dialog, Parameters tab
See below for option descriptions on the Neural Network Classification - Parameters dialog. Note: The Neural Network Automatic Classification – Parameters dialog does not include Architecture, but is otherwise the same.
Partition Data
Analytic Solver Data Science includes the ability to partition a dataset from within a classification or prediction method by clicking Partition Data Parameters dialog. Analytic Solver Data Science will partition your dataset (according to the partition options you set) immediately before running the classification method. If partitioning has already occurred on the dataset, this option will be disabled. For more information on partitioning, please see the Data Science Partitioning chapter.
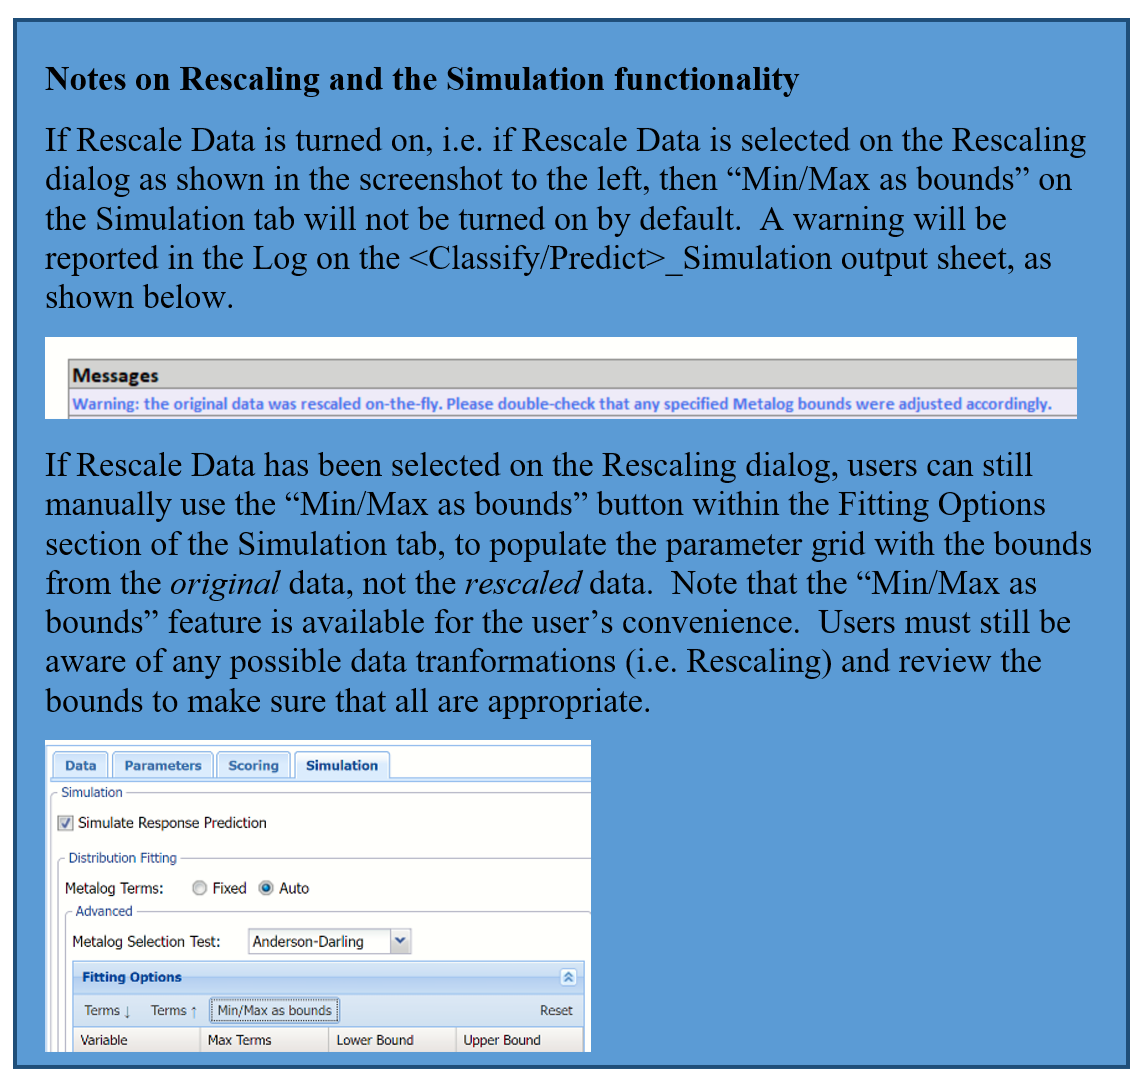
Rescale Data
Click Rescale Data to open the Rescaling dialog.
Use Rescaling to normalize one or more features in your data during the data preprocessing stage. Analytic Solver Data Science provides the following methods for feature scaling: Standardization, Normalization, Adjusted Normalization and Unit Norm. For more information on this new feature, see the Rescale Continuous Data section within the Transform Continuous Data chapter that occurs earlier in this guide.
Hidden Layers/Neurons
Click Add Layer to add a hidden layer. To delete a layer, click Remove Layer. Once the layer is added, enter the desired Neurons.
Hidden Layer
Nodes in the hidden layer receive input from the input layer. The output of the hidden nodes is a weighted sum of the input values. This weighted sum is computed with weights that are initially set at random values. As the network “learns”, these weights are adjusted. This weighted sum is used to compute the hidden node’s output using a transfer function. Select Sigmoid (the default setting) to use a logistic function for the transfer function with a range of 0 and 1. This function has a “squashing effect” on very small or very large values but is almost linear in the range where the value of the function is between 0.1 and 0.9. Select Hyperbolic Tangent to use the tanh function for the transfer function, the range being -1 to 1. If more than one hidden layer exists, this function is used for all layers. The default selection is Standard.
Output Layer
As in the hidden layer output calculation (explained in the above paragraph), the output layer is also computed using the same transfer function as described for Activation: Hidden Layer. Select Sigmoid (the default setting) to use a logistic function for the transfer function with a range of 0 and 1. Select Hyperbolic Tangent to use the tanh function for the transfer function, the range being -1 to 1.
In neural networks, the Softmax function is often implemented at the final layer of a classification neural network to impose the constraints that the posterior probabilities for the output variable must be >= 0 and <= 1 and sum to 1. Select Softmax to utilize this function.
The default selection is Standard.
Prior Probability
Click Prior Probability. Three options appear in the Prior Probability Dialog: Empirical, Uniform and Manual.
If the first option is selected, Empirical, Analytic Solver Data Science will that the probability of encountering a particular class in the dataset is the same as the frequency with which it occurs in the training data.
If the second option is selected, Uniform, Analytic Solver Data Science will assume that all classes occur with equal probability.
Select the third option, Manual, to manually enter the desired class and probability value.
Training Parameters
Click Training Parameters to open the Training Parameters dialog to specify parameters related to the training of the Neural Network algorithm.
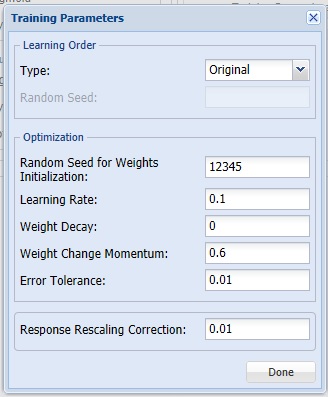
Learning Order [Original or Random]
This option specifies the order in which the records in the training dataset are being processed. It is recommended to shuffle the training data to avoid the possibility of processing correlated reocrds in order. It also helps the neural network algorithm to converge faster. If Random is selected, Random Seed is enabled. If Original is selected, the algorithm will use the original order of records.
Learning Order [Random Seed]
This option specifies the seed for shuffling the training records. Note that different random shuffling may lead to different results, but as long as the training data is shuffled, different ordering typically does not result in drastic changes in performance.
Random Seed for Weights Initialization
If an integer value appears for Random Seed for Weights Initialization, Analytic Solver Data Science will use this value to set the seed for the initial assignment of the neuron values. Setting the random number seed to a nonzero value (any number of your choice is OK) ensures that the same sequence of random numbers is used each time the neuron values are calculated. The default value is “12345”. If left blank, the random number generator is initialized from the system clock, so the sequence of random numbers will be different in each calculation. If you need the results from successive runs of the algorithm to another to be strictly comparable, you should set the seed. To do this, type the desired number you want into the box.
Learning Rate
This is the multiplying factor for the error correction during backpropagation; it is roughly equivalent to the learning rate for the neural network. A low value produces slow but steady learning, a high value produces rapid but erratic learning. Values for the step size typically range from 0.1 to 0.9.
Weight Decay
To prevent over-fitting of the network on the training data, set a weight decay to penalize the weight in each iteration. Each calculated weight will be multiplied by (1-decay).
Weight Change Momentum
In each new round of error correction, some memory of the prior correction is retained so that an outlier that crops up does not spoil accumulated learning.
Error Tolerance
The error in a particular iteration is backpropagated only if it is greater than the error tolerance. Typically error tolerance is a small value in the range from 0 to 1.
Response Rescaling Correction
This option specifies a small number, which is applied to the Normalization rescaling formula, if the output layer activation is Sigmoid (or Softmax in Classification), and Adjusted Normalization, if the output layer activation is Hyperbolic Tangent. The rescaling correction ensures that all response values stay within the range of activation function.
Stopping Rules
Click Stopping Rules to open the Stopping Rules dialog. Here users can specify a comprehensive set of rules for stopping the algorithm early plus cross-validation on the training error.
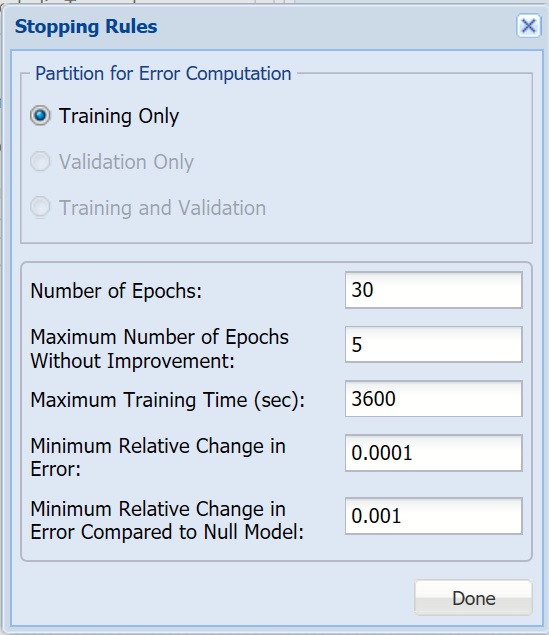
Partition for Error Computation
Specifies which data partition is used to estimate the error after each training epoch.
Number of Epochs
An epoch is one sweep through all records in the training set. Use this option to set the number of epochs to be performed by the algorithm.
Maximum Number of Epochs Without Improvement
The algorithm will stop after this number of epochs has been completed, and no improvement has ben realized.
Maximum Training Time
The algorithm will stop once this time (in seconds) has been exceeded.
Keep Minimum Relative Change in Error
If the relative change in error is less than this value, the algorithm will stop.
Keep Minimum Relative Change in Error Compared to Null Model
If the relative change in error compared to the Null Model is less than this value, the algorithm will stop. Null Model is the baseline model used for comparing the performance of the neural network model.
Neural Network Classification dialog, Scoring tab
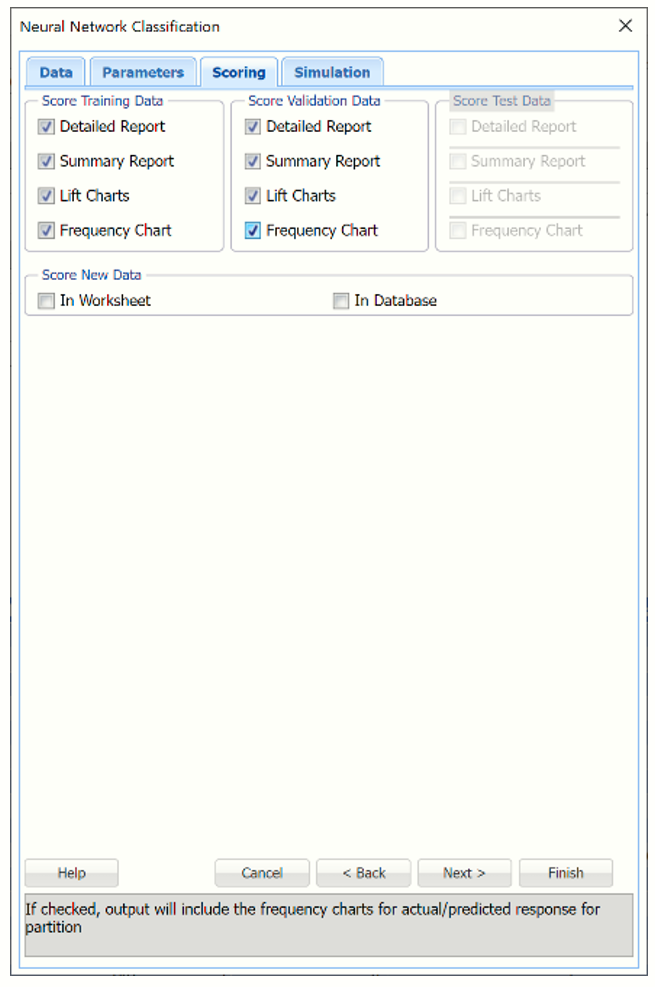
New in V2023: When Frequency Chart is selected, a frequency chart will be displayed when the NNC_TrainingScore worksheet is selected. This chart will display an interactive application similar to the Analyze Data feature, explained in detail in the Analyze Data chapter that appears earlier in this guide. This chart will include frequency distributions of the actual and predicted responses individually, or side-by-side, depending on the user’s preference, as well as basic and advanced statistics for variables, percentiles, six sigma indices.
Score Training Data
Select these options to show an assessment of the performance of the algorithm in classifying the training data. The report is displayed according to your specifications - Detailed, Summary, Lift charts and Frequency. Lift charts are only available when the Output Variable contains 2 categories.
Score Validation Data
These options are enabled when a validation dataset is present. Select these options to show an assessment of the performance of the algorithm in classifying the validation data. The report is displayed according to your specifications - Detailed, Summary, Lift charts and Frequency. Lift charts are only available when the Output Variable contains 2 categories.
Score Test Data
These options are enabled when a test dataset is present. Select these options to show an assessment of the performance of the algorithm in classifying the test data. The report is displayed according to your specifications - Detailed, Summary, Lift charts and Frequency. Lift charts are only available when the Output Variable contains 2 categories.
Score New Data
For information on scoring in a worksheet or database, please see the chapters “Scoring New Data” and “Scoring Test Data” in the Analytic Solver Data Science User Guide.
Neural Network Classification dialog, Simulation tab
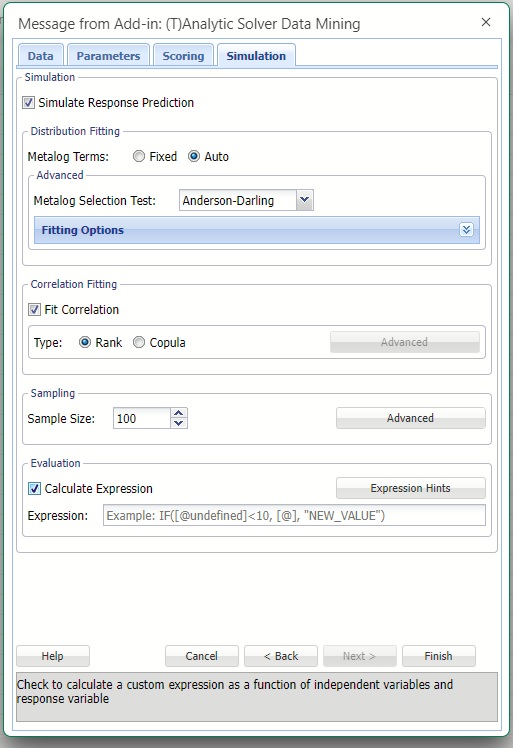
All supervised algorithms in V2023 include a new Simulation tab. This tab uses the functionality from the Generate Data feature (described earlier in this guide) to generate synthetic data based on the training partition, and uses the fitted model to produce predictions for the synthetic data. The resulting report, NNC_Simulation, will contain the synthetic data, the predicted values and the Excel-calculated Expression column, if present. In addition, frequency charts containing the Predicted, Training, and Expression (if present) sources or a combination of any pair may be viewed, if the charts are of the same type.
Evaluation: Select Calculate Expression to amend an Expression column onto the frequency chart displayed on the NNC_Simulation output tab. Expression can be any valid Excel formula that references a variable and the response as [@COLUMN_NAME]. Click the Expression Hints button for more information on entering an expression.